Analytics | Understanding premade dashboards in Analytics
Requirements
Analytics feature vary depending on the plan: Bigblue, Advanced, or Plus. Contact us to learn more about access to additional data and features.
What are premade dashboards?
Bigblue provides pre-configured dashboards to help merchants monitor key business, logistics and operational metrics at a glance. Available dashboards are:
- Overview – A global view of your business activity.
- Billing insights – A detailed breakdown of your costs.
- Inventory insights - A clear view of product trends and stock health
- Operations performance – Key metrics for carrier services
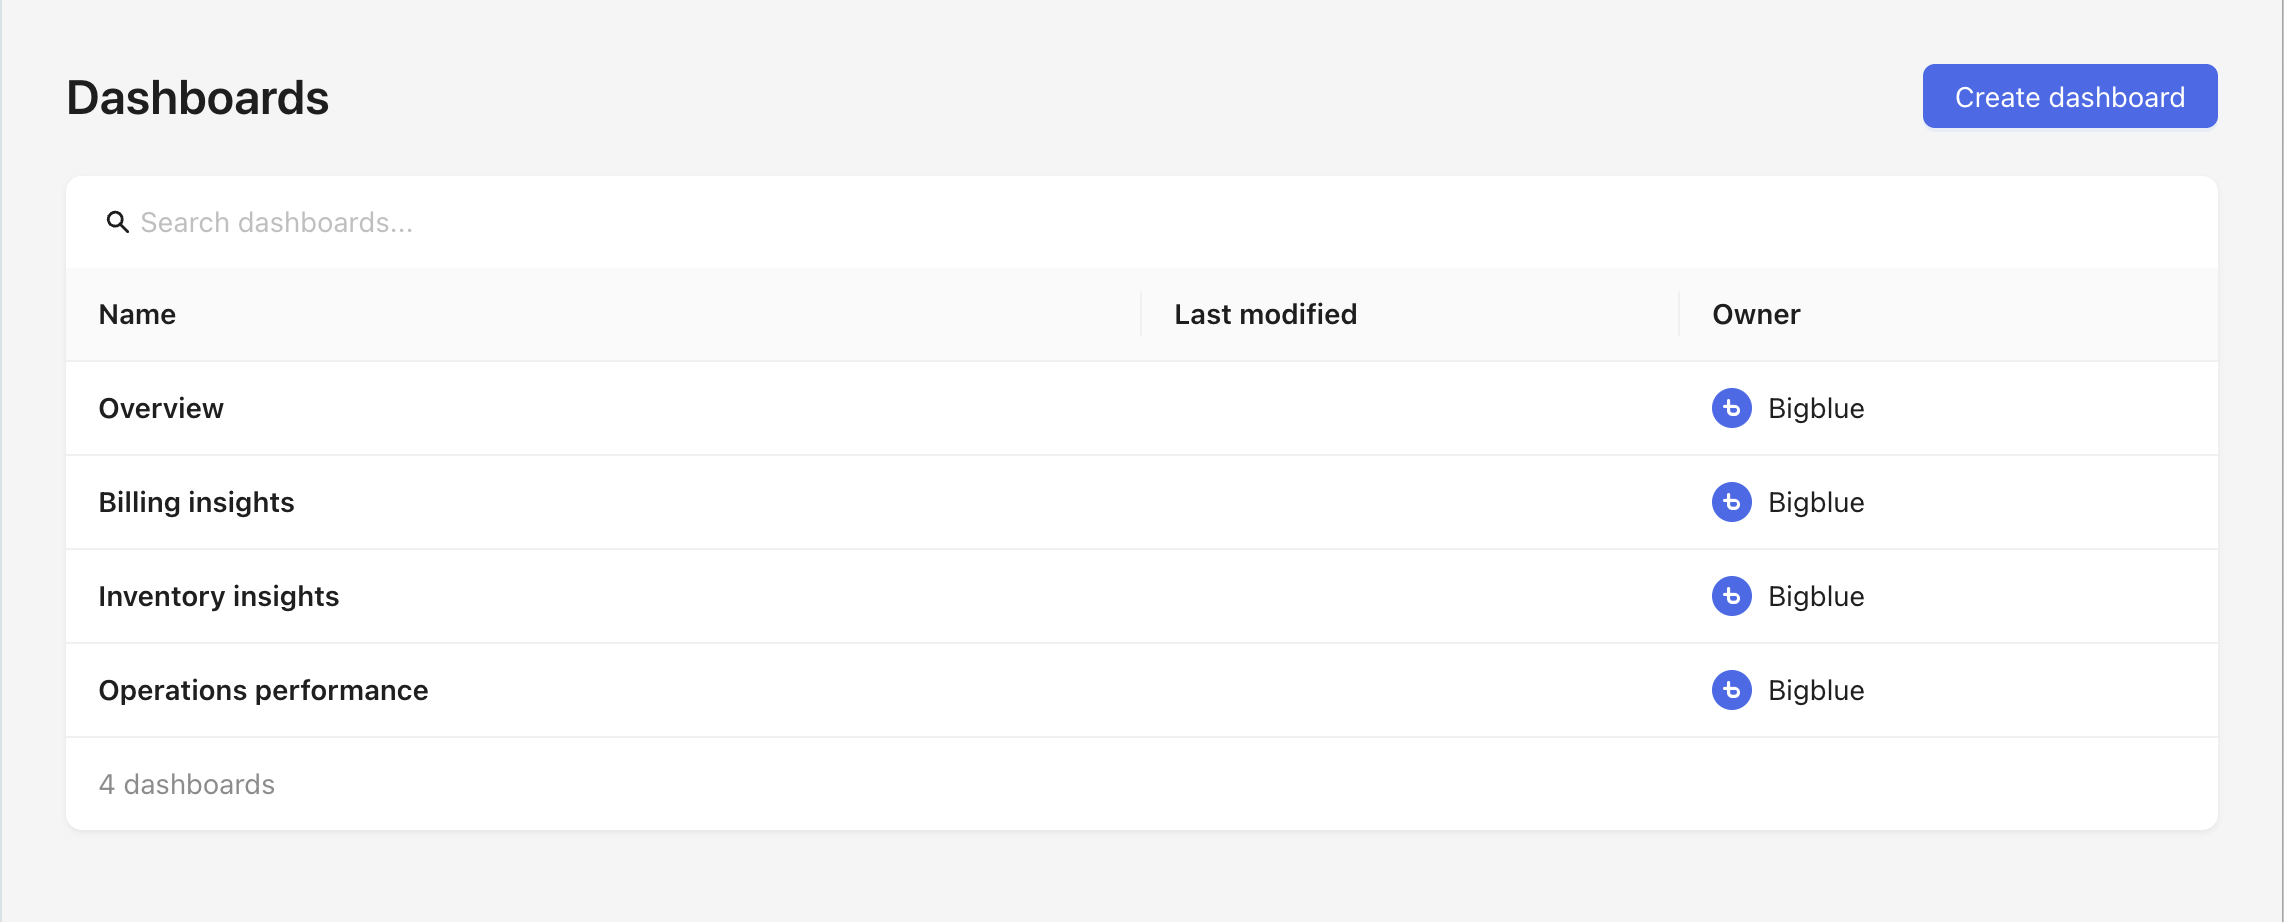
Discover available dashboards
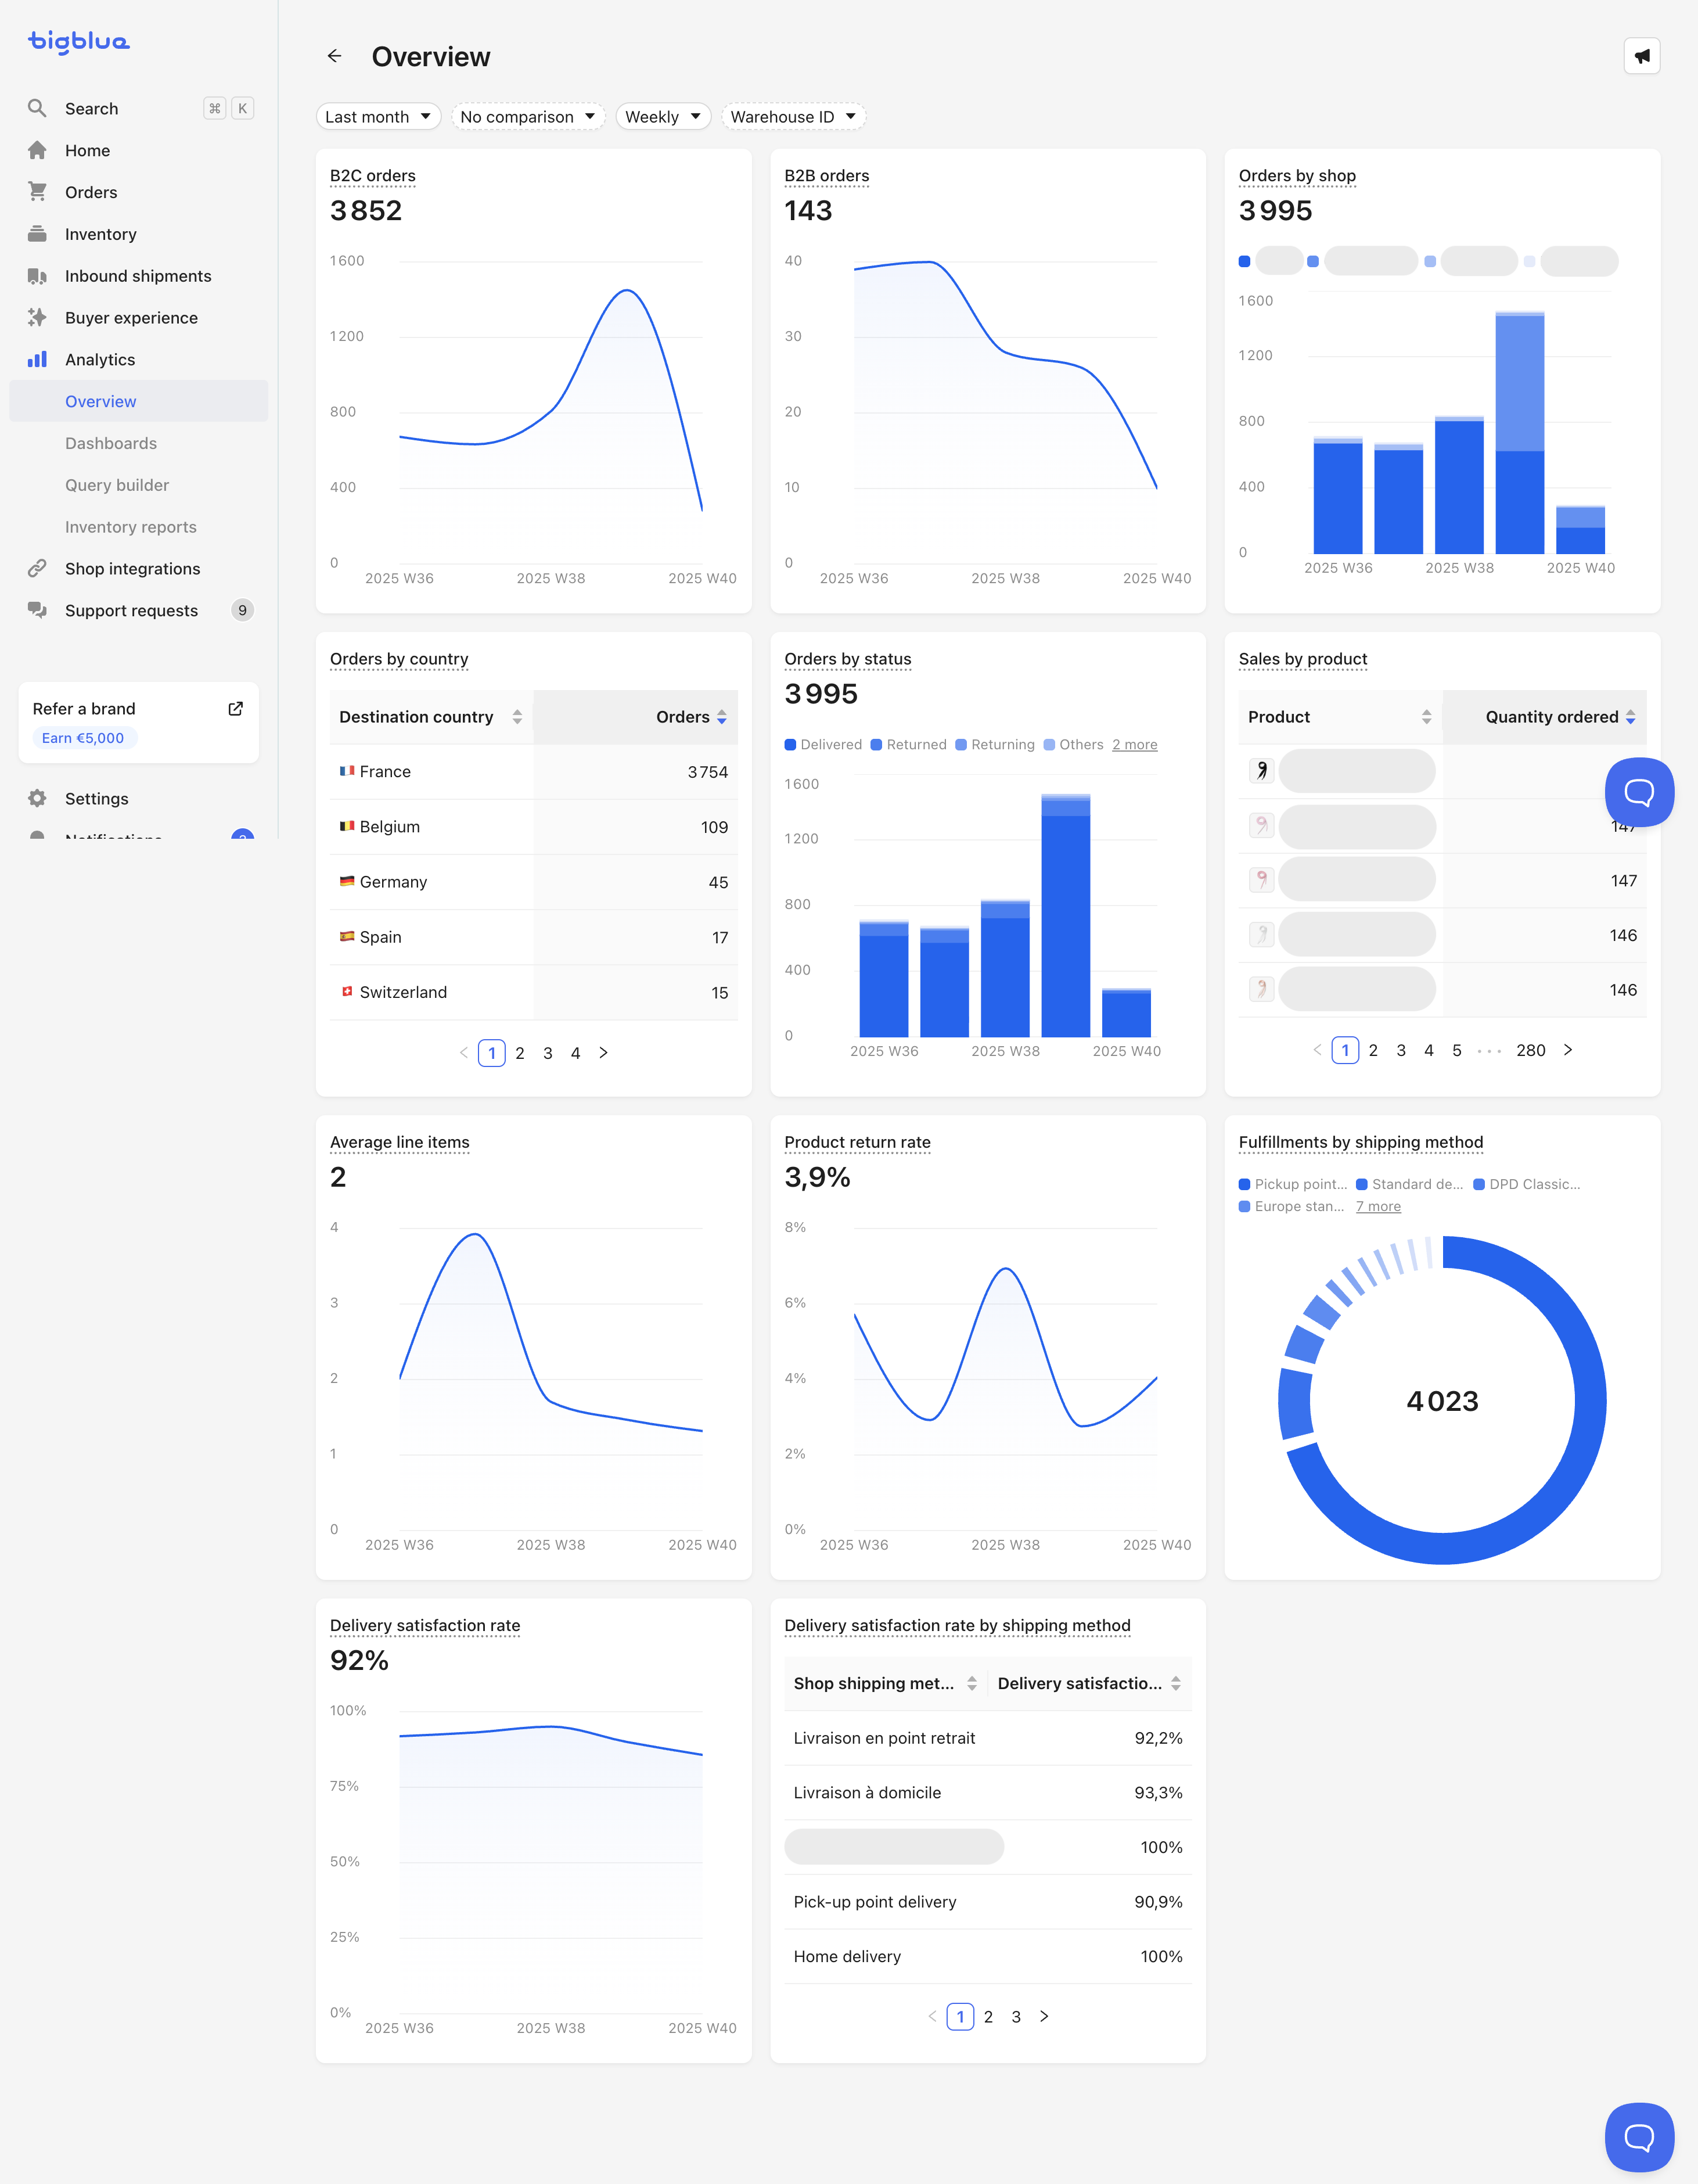
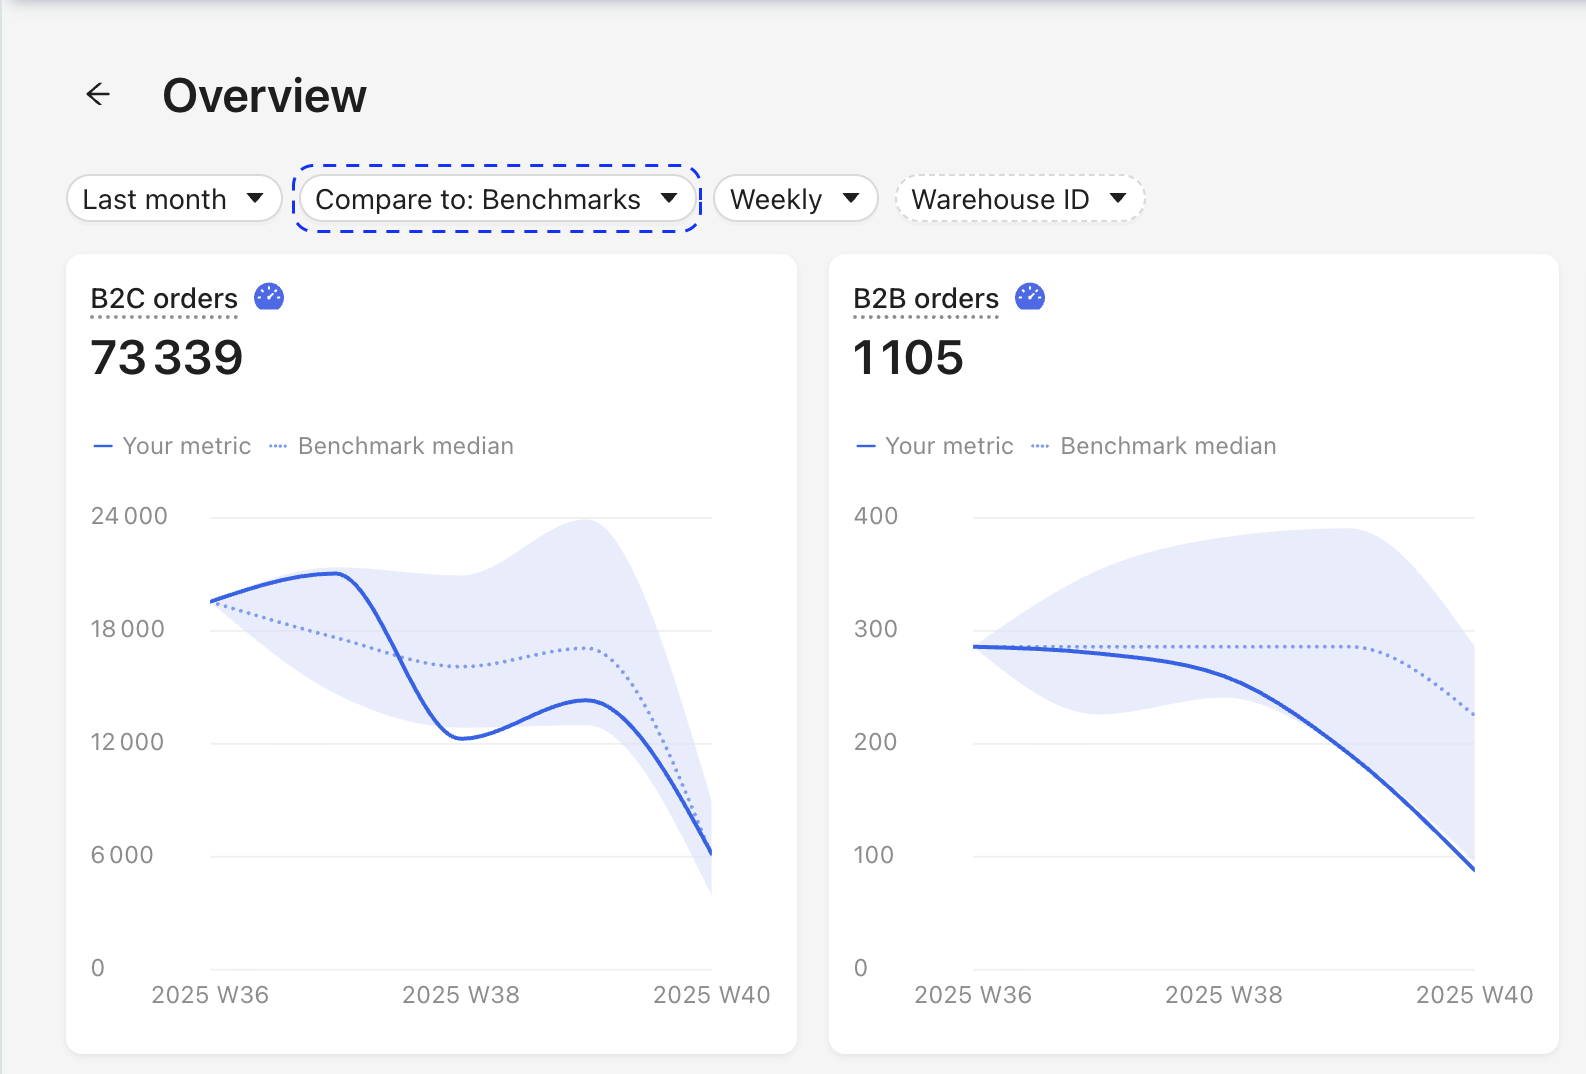
🔍 Overview dashboard
The Overview dashboard gives a high-level picture of your fulfillment activity. It’s your go-to for quickly assessing:
- Orders by shop, country, and channel (B2B vs B2C)
- Sales breakdown by product
- Global return rate trend
- Buyer satisfaction global (overall and by shipping method)
- Shipping method distribution
💰 Billing insights dashboard
From the Advanced plan onwards
The Billing Insights dashboard dives into your logistics costs, including:
- Total invoice amount by service
- Total fulfillment cost by channel (B2B vs B2C)
- Average fulfillment cost* by shop, country, channel (B2B vs B2B), and shipping method
- Storage, returns, fulfillment customization cost.
- Refund and compensation amounts
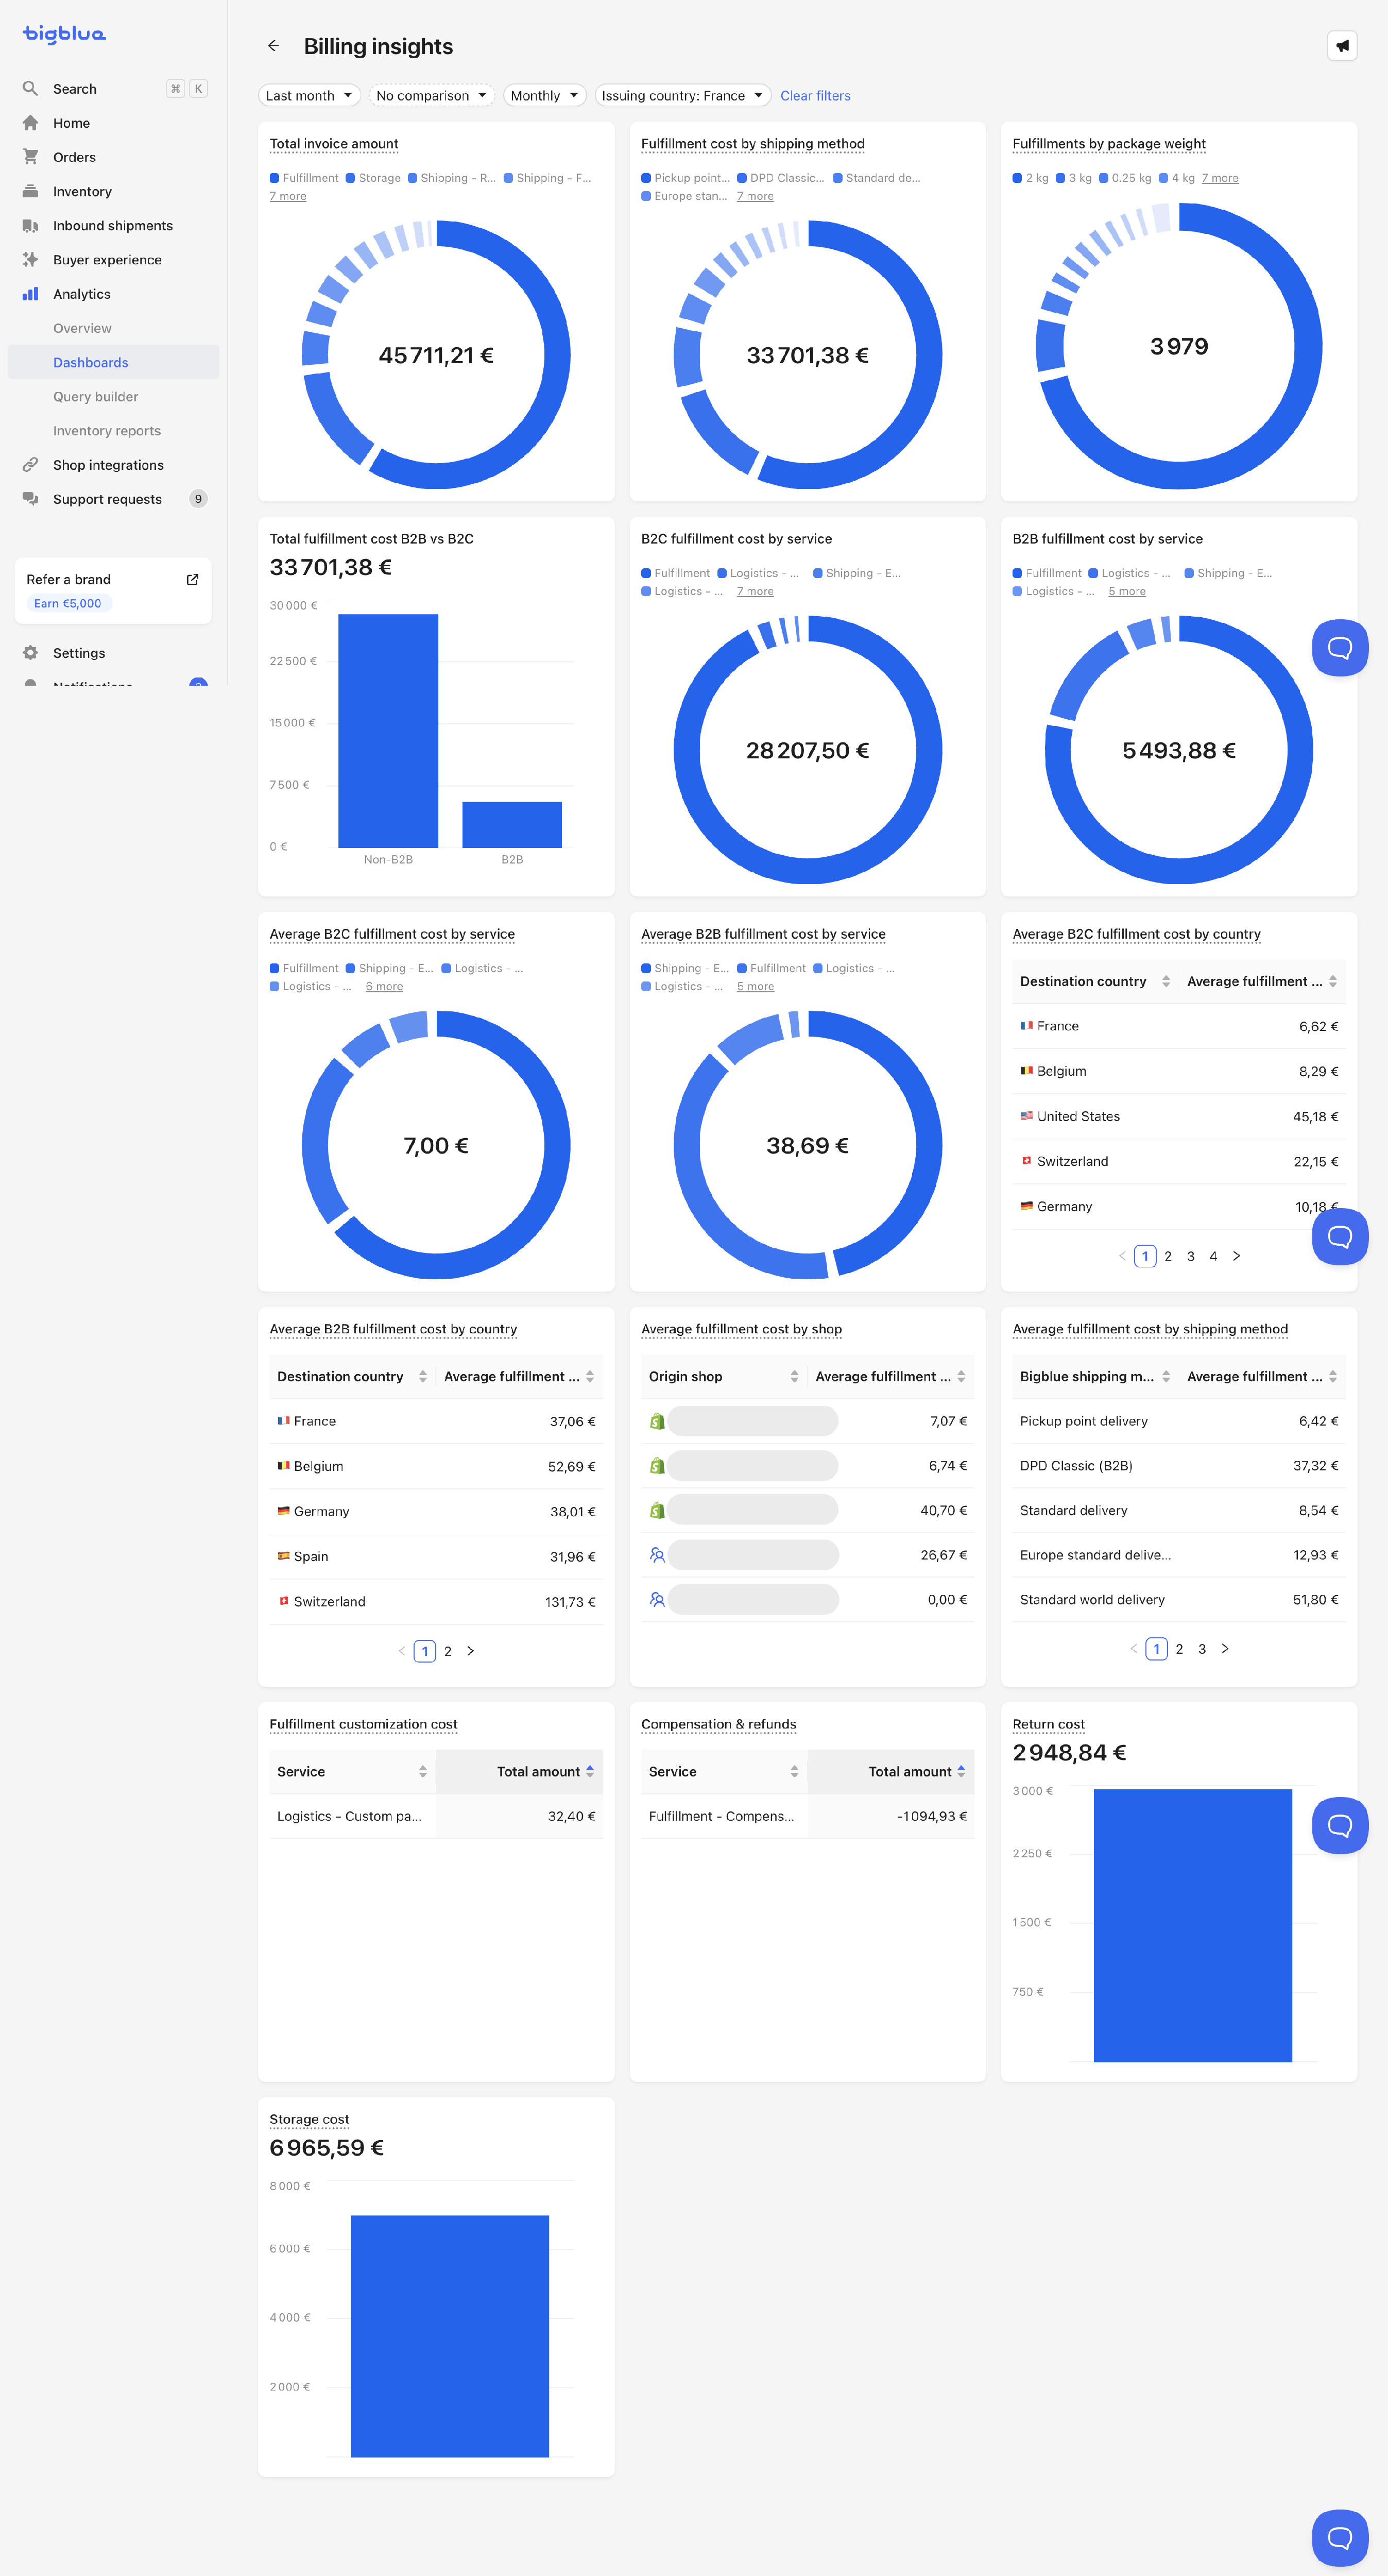
*Average fulfillment cost includes Picking, Packing, Customization, and Shipping. It does not include Refunded/Compensated amounts or Shipping Insurance.
🧦 Inventory insights dashboard
From the Advanced plan onwards
The Inventory Performance dashboard helps you track how your products are moving and where stock is concentrated. Use it to monitor:
- Sales volumes by product
- Product return rates over time
- Ending stock quantity by product
- Inventory age distribution (fresh vs. aging stock)
- Stock levels by product and age group

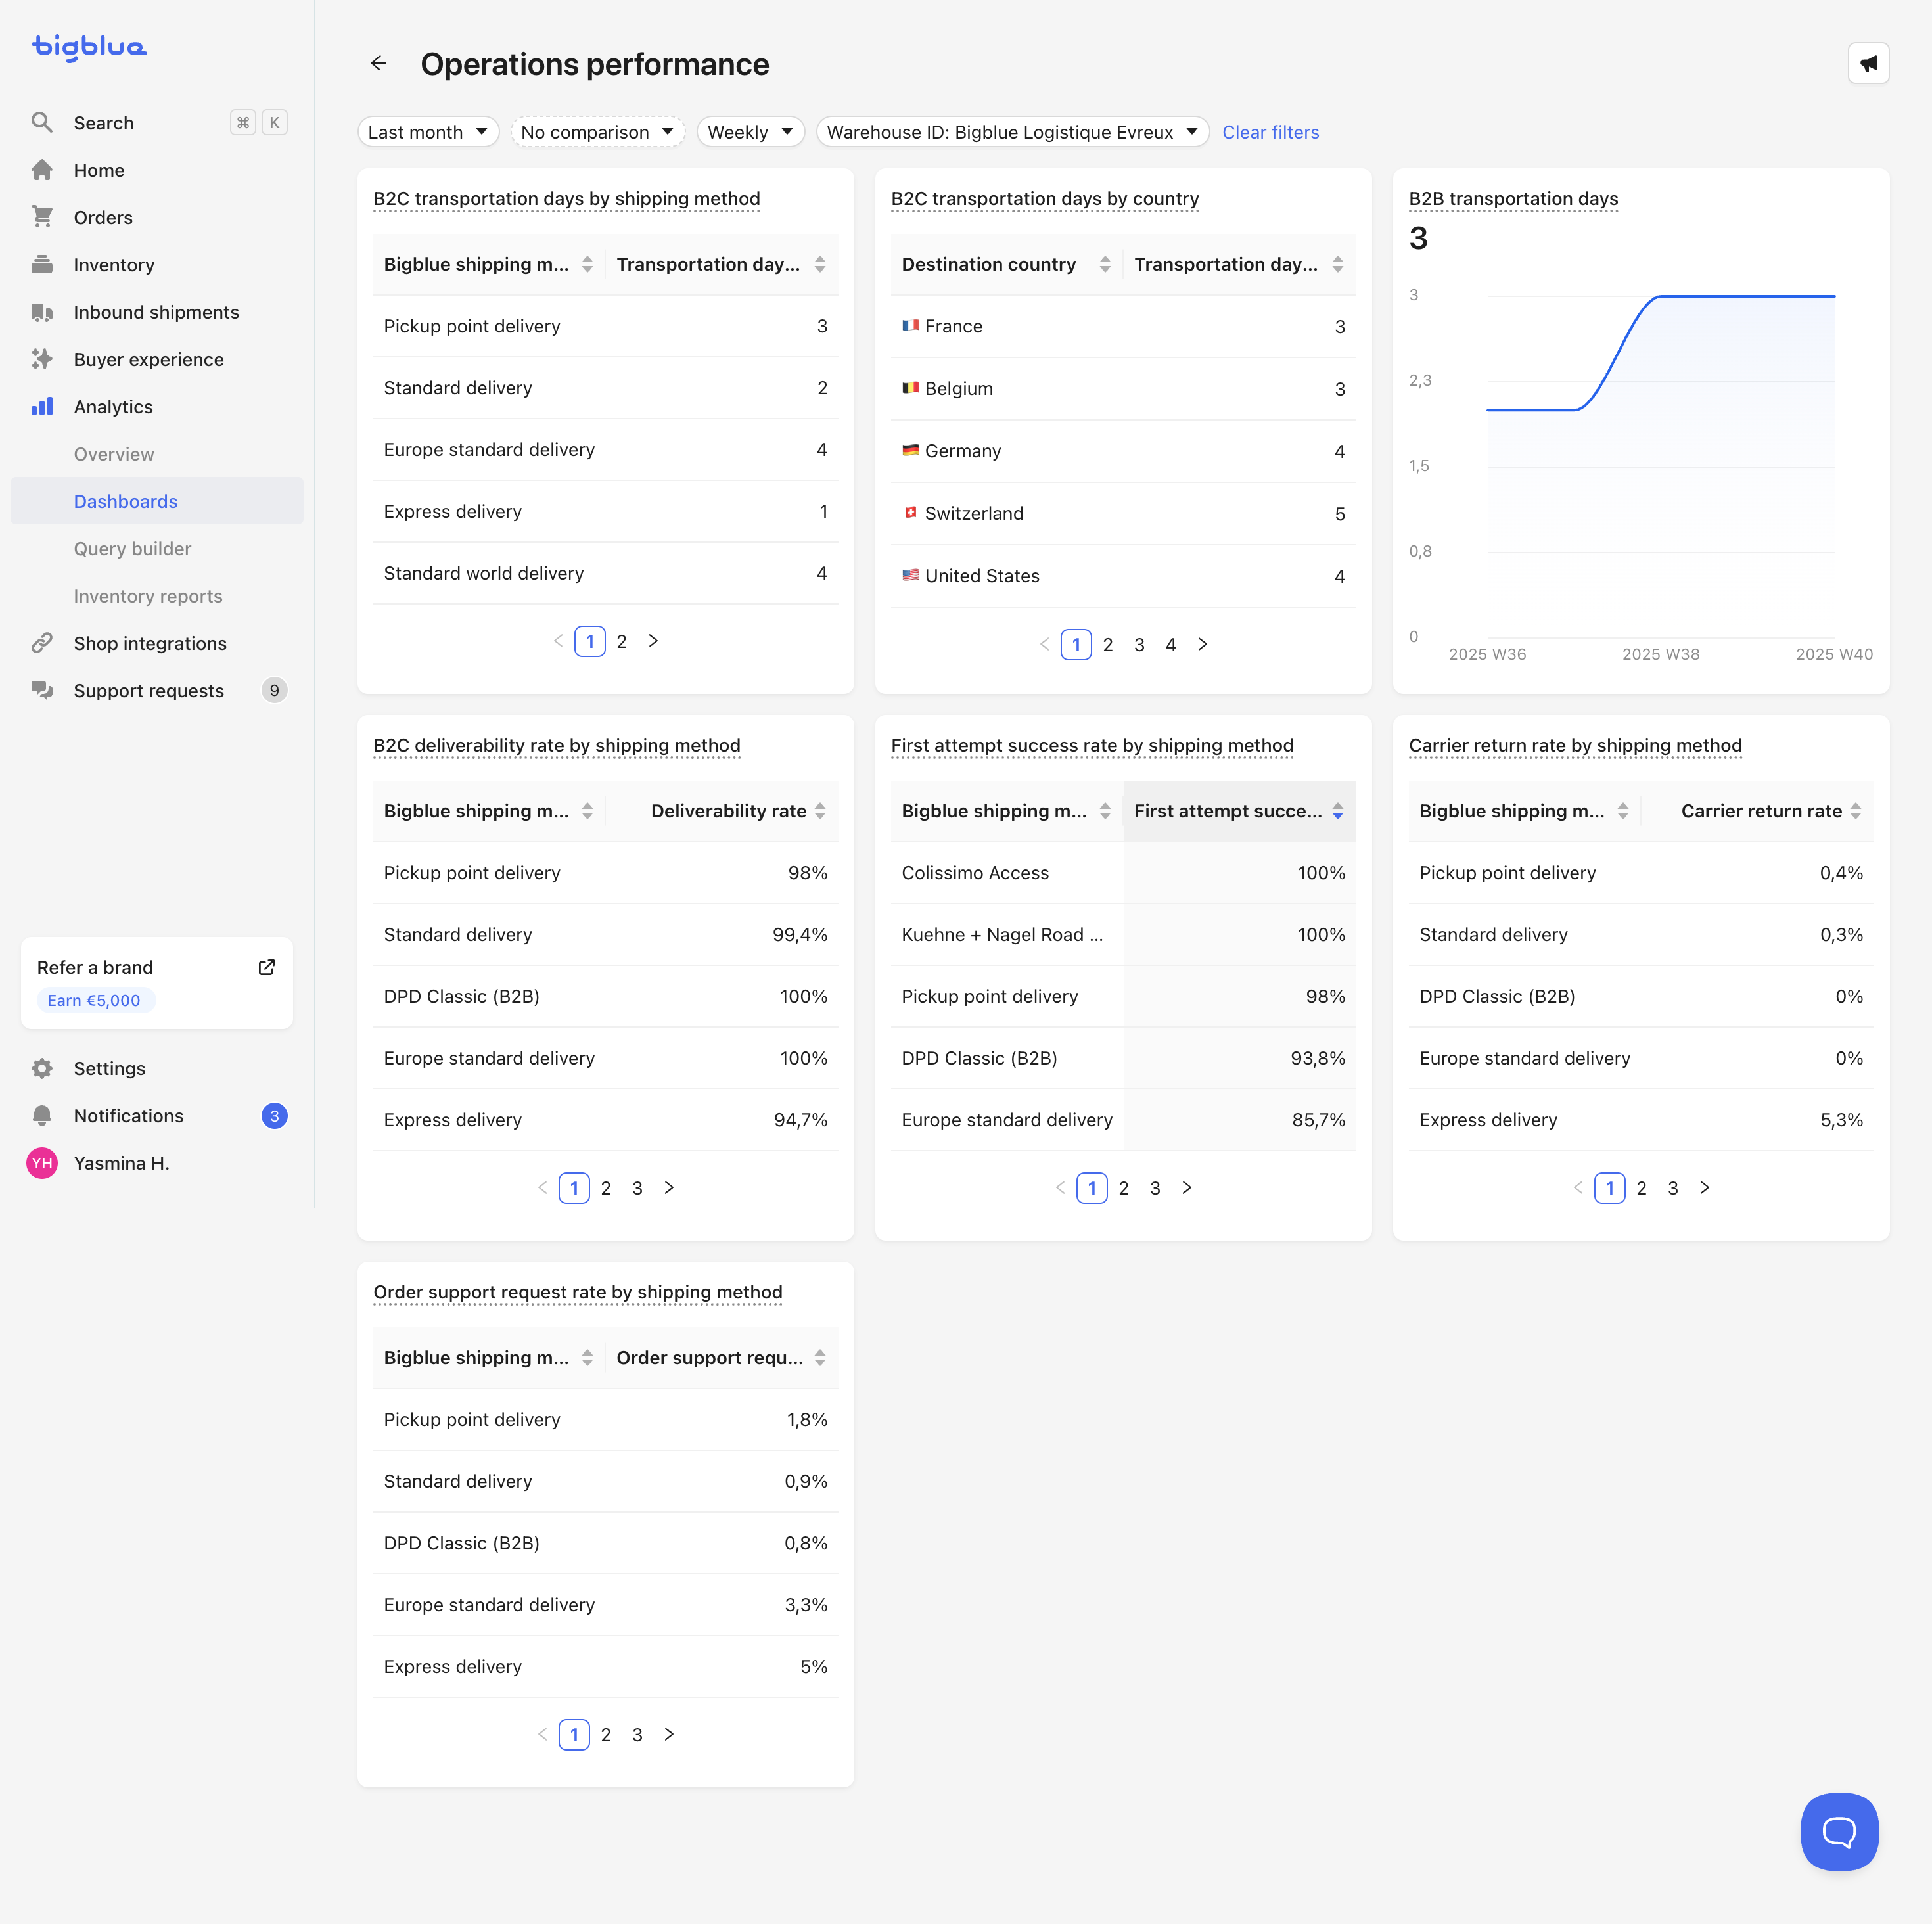
🏋️ Operations performance dashboard
From the Advanced plan onwards
The Operation performance dashboard helps you monitor the operational performance of carrier services. Use it to monitor:
- Transportation days for B2C orders, by shipping method or destination country
- Transportation days for B2B orders
- Deliverability rate, First attempt success rate, Carrier return rate and Orders support request rate by shipping method
Interact with available dashboards
Time settings and comparison options
All dashboards support key time-based controls:
- Time period filter (mandatory) – Sets the reporting range (e.g. last month)
- Comparison selector (optional) – Compare with a previous period
- Time breakdown (optional) – View results daily, weekly, or monthly

Benchmark comparison
Available for the Plus plan only
The Benchmark comparison feature allows you to contextualize your performance by comparing your own order trends with those of other merchants operating in the same geographic area.
Use it to identify opportunities by comparing your order trends and growth dynamics with aggregated, anonymized data from other merchants in the same region.
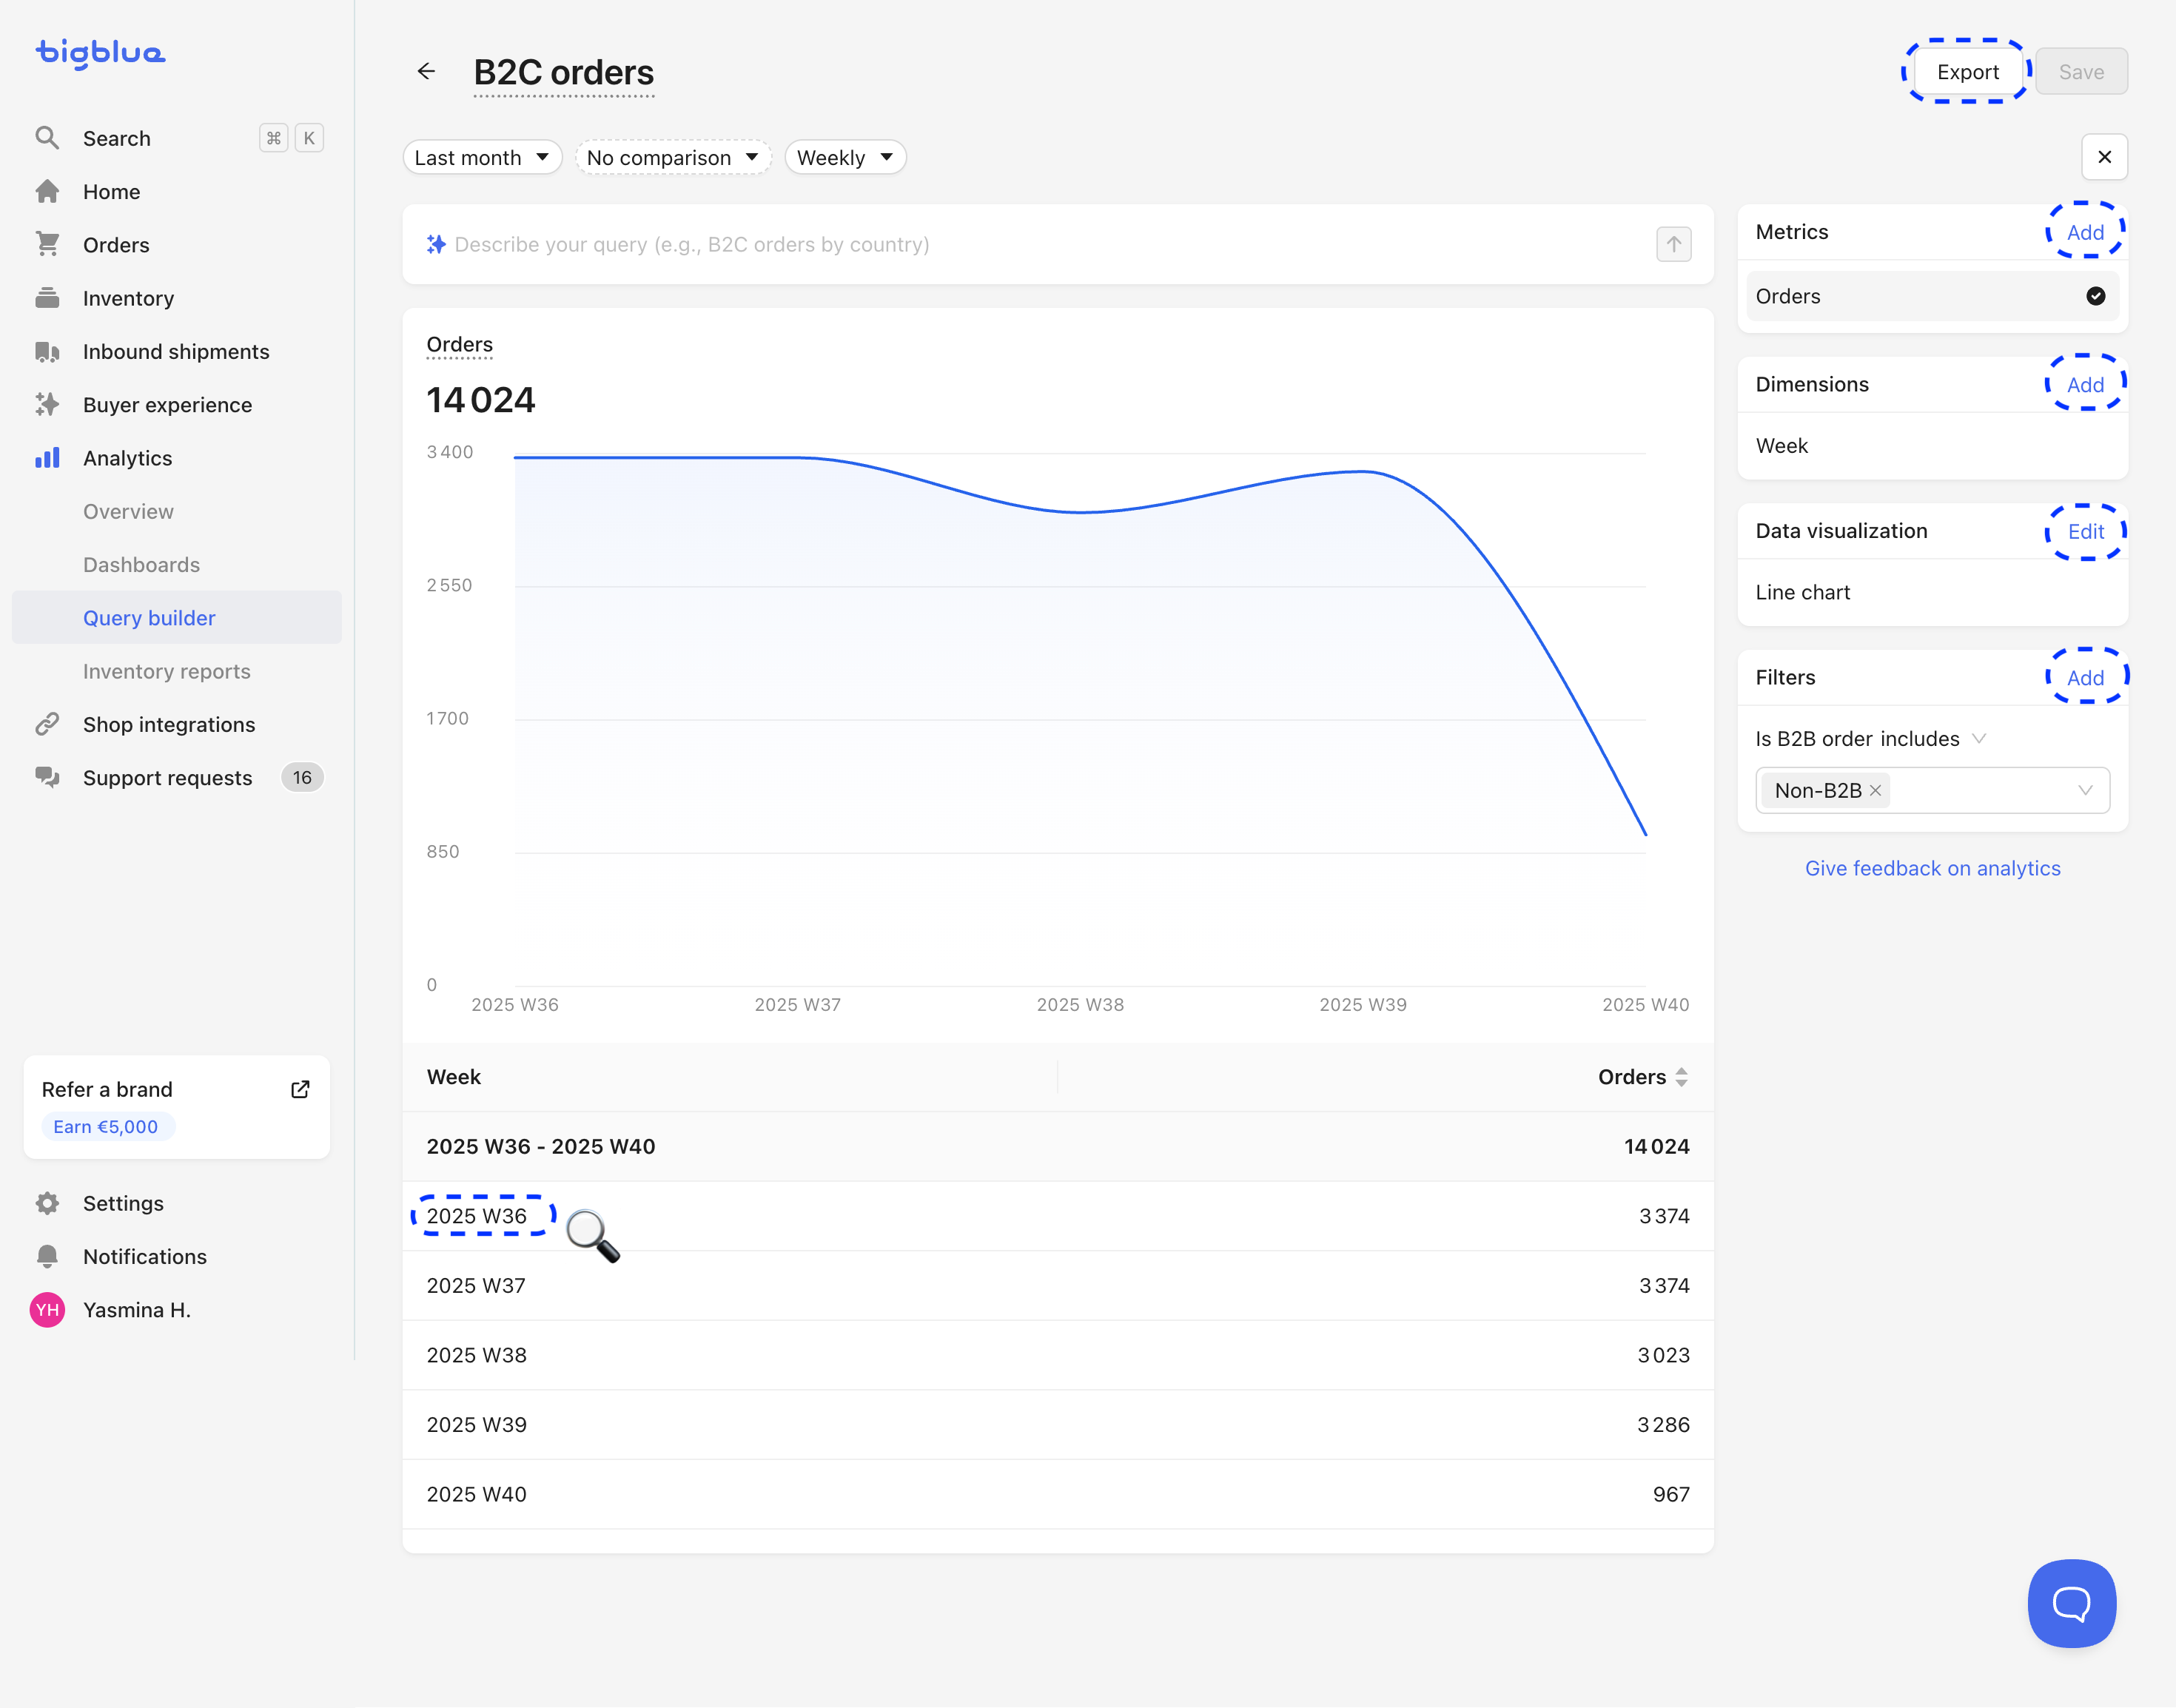
Interact and customize
All charts in premade dashboards are interactive and give you control over the insights you want to explore:
- Click any chart to view and modify the corresponding query
- Drill down to see the underlying data, for example, the individual orders, returns, or fulfillment records behind a given metric
- Export the data shown in a chart as a
.csvfile for further analysis or sharing
⚠️ You cannot save changes to the default dashboard, but you can create your own dashboard and copy existing queries to customize them.
Create dashboards that match your monitoring needs
While premade dashboards provide a solid foundation, you may want more personalized monitoring. This could mean:
- Grouping metrics in a way that reflects your internal workflows
- Comparing data by custom dimensions
- Focusing on specific KPIs depending on your business priorities